RRCHNM’s Custom API for Data-Driven Projects
RRCHNM is a shop that is more and more working on computational history and historical data visualization. But we are also first and foremost a web shop: ever since Roy Rosenzweig saw the potential of the internet and left CD ROMs behind, we’ve been committed to delivering history via people’s web browsers. Those two commitments are becoming increasingly compatible. For example, Ben Schmidt has written persuasively about the next decade of data programming happening in the browser via JavaScript. But combining data analysis and the web takes work. In this blog post, I want to explain how we are solving one aspect of that challenge via our custom data API.
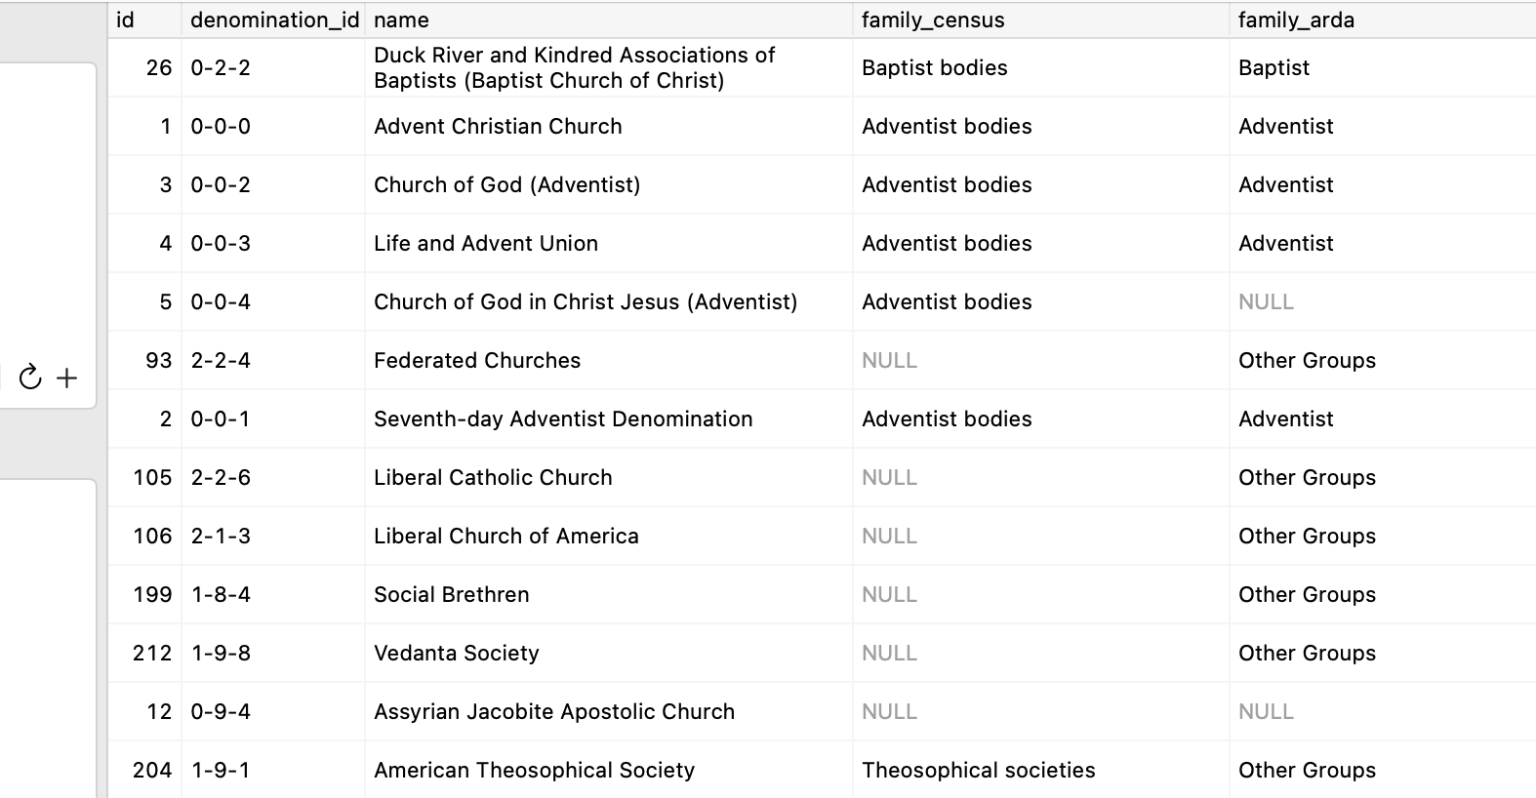
We have a lot of datasets in play for RRCHNM’s projects. Some of the spatial datasets, such as Natural Earth and the Atlas of Historic County Boundaries, we use over and over across projects. AHCB is a critical part of both Mapping Early American Elections and American Religious Ecologies. Some of the datasets are small and intended for display. Others are large text corpora, such as Chronicling America, Gale’s Making of Modern Law, or all of the full text collections from the Library of Congress gathered as part of Computing Cultural Heritage in the Cloud, from which we compute derivative datasets of biblical quotations, legal citations, or the like. Even those derivative datasets can be fairly large and unwieldy. And other datasets are ones that we are transcribing ourselves using our DataScribe tool. These include the data about religious congregations from the 1926 Census of Religious Bodies and about London’s bills of mortality.
The version of record for these datasets is typically a PostgreSQL database. We use a relational database for—well—all the reasons everyone else uses relational databases. In particular, we value the strong guarantees a database provides about the data being strongly typed and well structured. We find it useful to be able to access the exact same data via, say, R for data analysis and a web application for display. And of course, there is the ability to query and index the data, combine datasets through joins, provide shared access, and so forth. PostgreSQL is not an exciting choice; it may very well be the least exciting choice imaginable. But rock solid and boring is a great place to be for critical infrastructure.
That still leaves the problem of getting the data out of the database and into the user’s browser. We needed a solution that could provide some key features:
- The data should be delivered in a format easily usable for web visualization, which means JSON or GeoJSON.
- The data should be reshaped as necessary. Frequently the form that data is stored in, typically some kind of normalized form, is not the way that the data should be structured for display.
- Large datasets must be queryable. Although browser can handle more and more, that does not mean that they should be made to do so, so ideally the minimum amount of data necessary should be sent to the browser.
- It should be easily extensible as we add new projects, and it should not require us to reinvent the wheel every time we start a new project. Rather, it should let us use existing data and functionality (such as the AHCB dataset I mentioned) across projects.
- And, if the need arises, it should allow the browser to write back to the database.

Our solution was to create a custom data API for RRCHNM projects, which we call Apiary. (Yes, we know other projects use that name, but this is just our internal codename.) The API is written in Go, a simple but powerful language well suited for our needs here. The API is containerized using Docker, for ease of deployment. The API essentially consists of a thin, fairly minimal application that provides the necessary boilerplate to set up a database connection, a web server, and so forth. Then individual endpoints that provide specific datasets are added as handlers. Adding a new dataset or view on a dataset is thus as straightforward as writing a new function in Go. But since those handlers fall into a few different types, in most instance the main work of adding a new endpoint is writing a new SQL query.
Our data API is available under an open-source license on GitHub. (You can also take a look at the API’s endpoints.) To be clear, this project is a highly-custom application, not a library or a general purpose application. Nearly all of the handlers would be of no use to non-RRCHNM projects, and you would have to create your own database, queries, endpoints, and so forth. But as we look around at the landscape of digital history and digital humanities projects, we see other projects that have a similar need to store, structure, query, and display data in the browser. Perhaps the general idea of a data API could prove useful to other institutions and scholars.